The English version is presented in the second part of this article, You can click on the "English" tab in the left sidebar to jump to the English version.
# 中文
Gitee 下载地址(压缩包含示例数据):https://gitee.com/BI6MHT/milky-way/releases/tag/heat21cm_v1.0
Github 下载地址(压缩包含示例数据):https://github.com/BI6MHT/MilkyWay/releases/tag/heat21cm_v1.0
百度云下载地址(压缩包含示例数据):链接: https://pan.baidu.com/s/1I4_mav3R0l5Cp-TxCmbZPA?pwd=wyvm 提取码: wyvm
谷歌云盘下载地址: https://drive.google.com/drive/folders/19zmq4YT6A4KnOzxtBIn0LwSbEksrK0qR?usp=drive_link
点击 heat21cm 的示例数据下载(单独一个示例数据)
# 一些展示
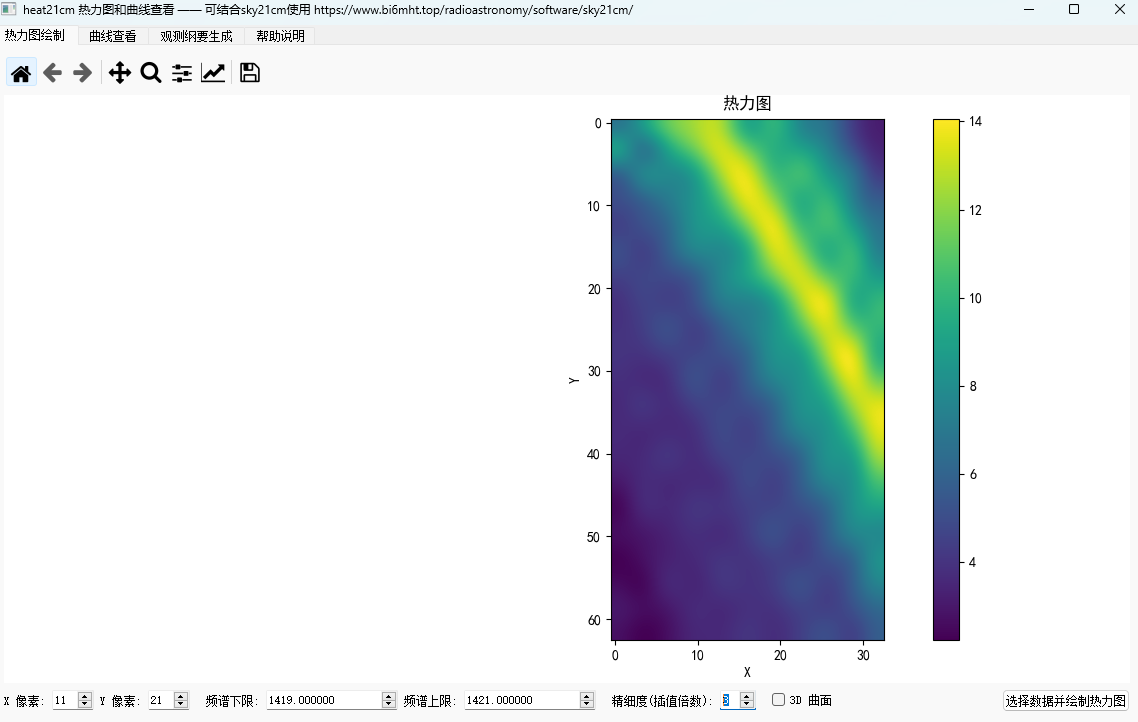
2D 热力图
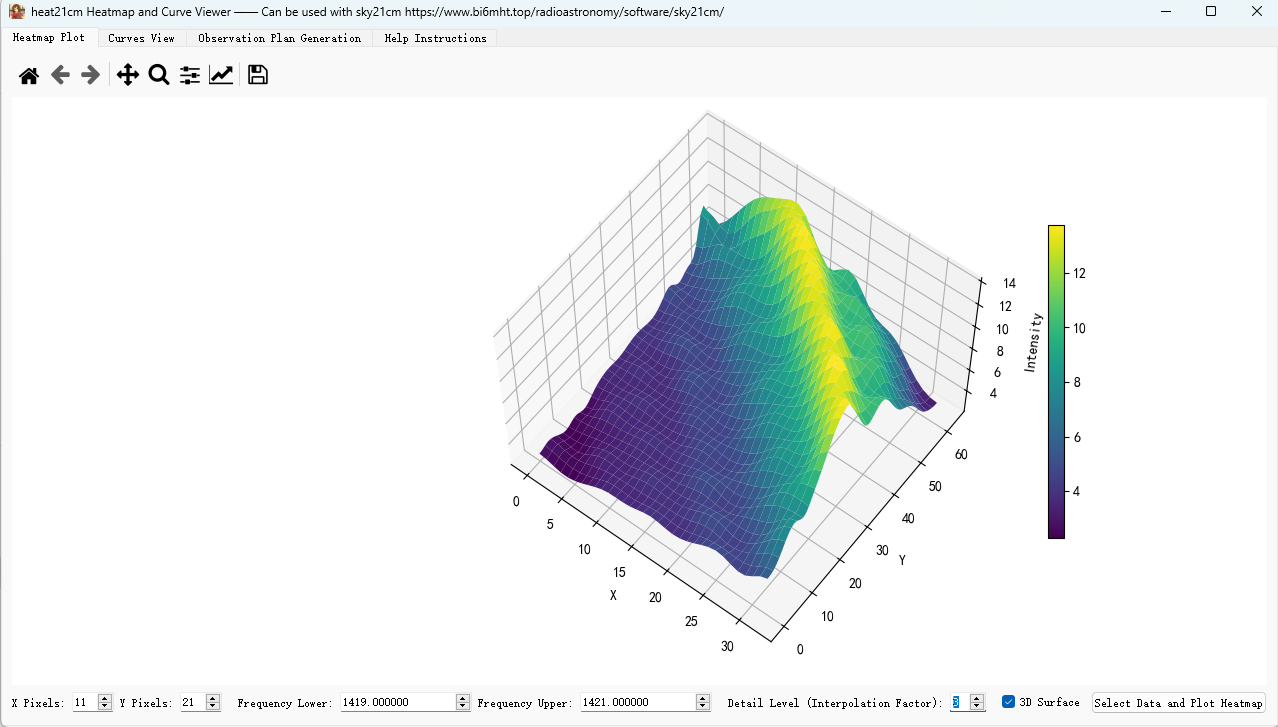
3D 热力图

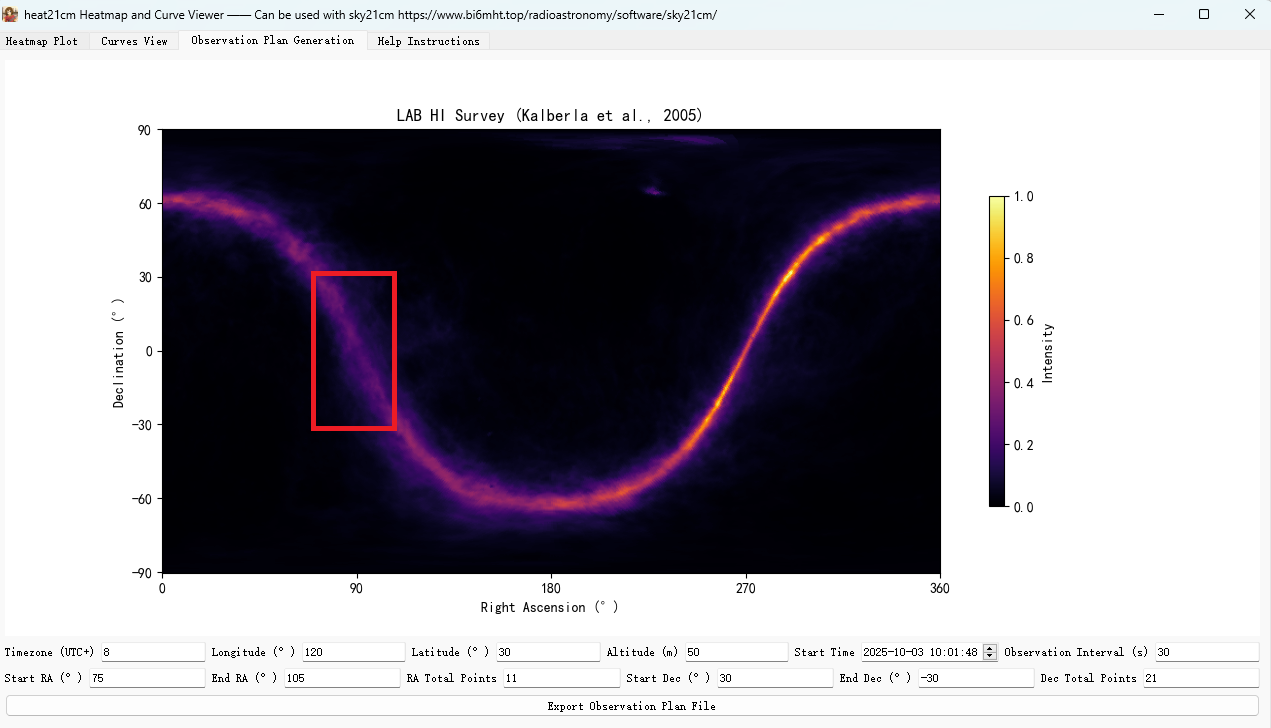
观测纲要文件生成

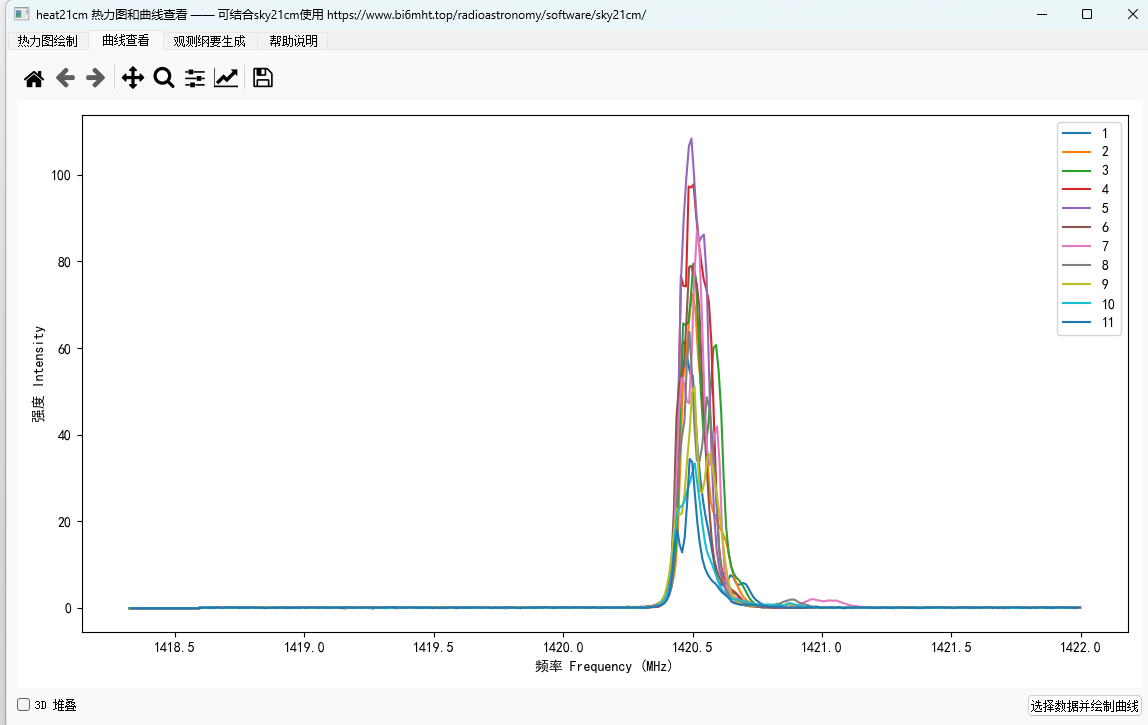
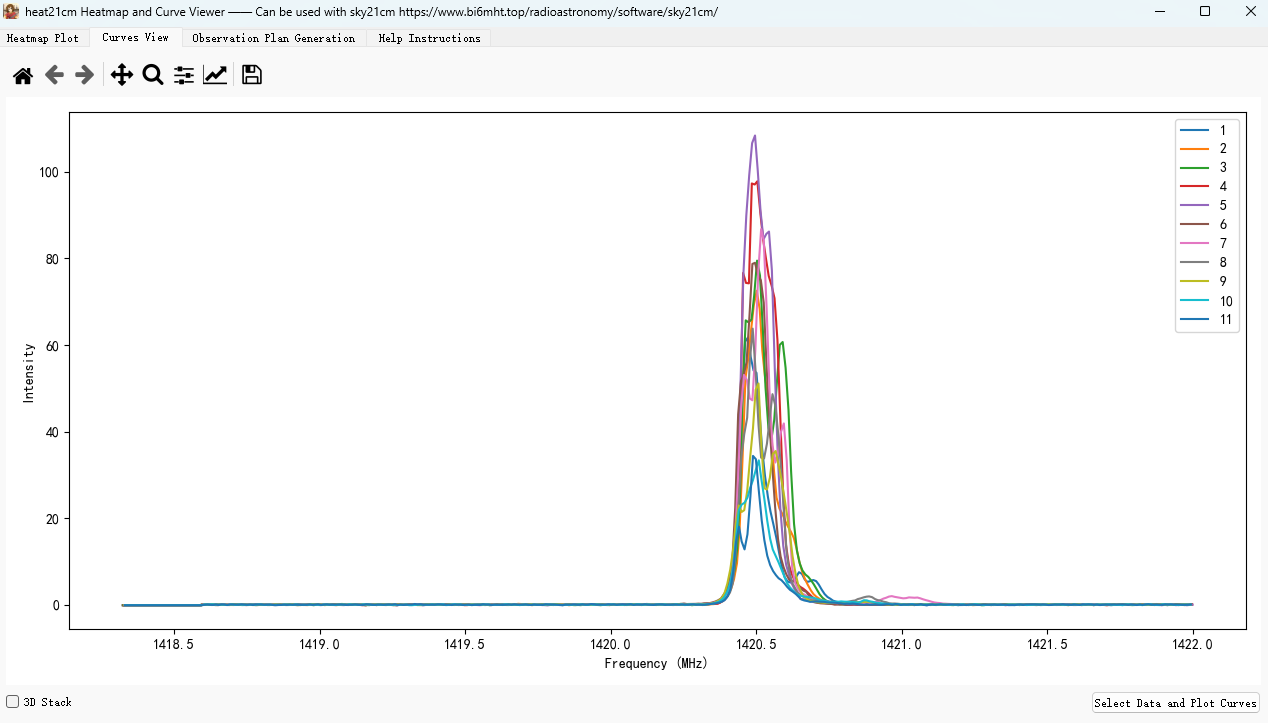
频谱文件查看 2D
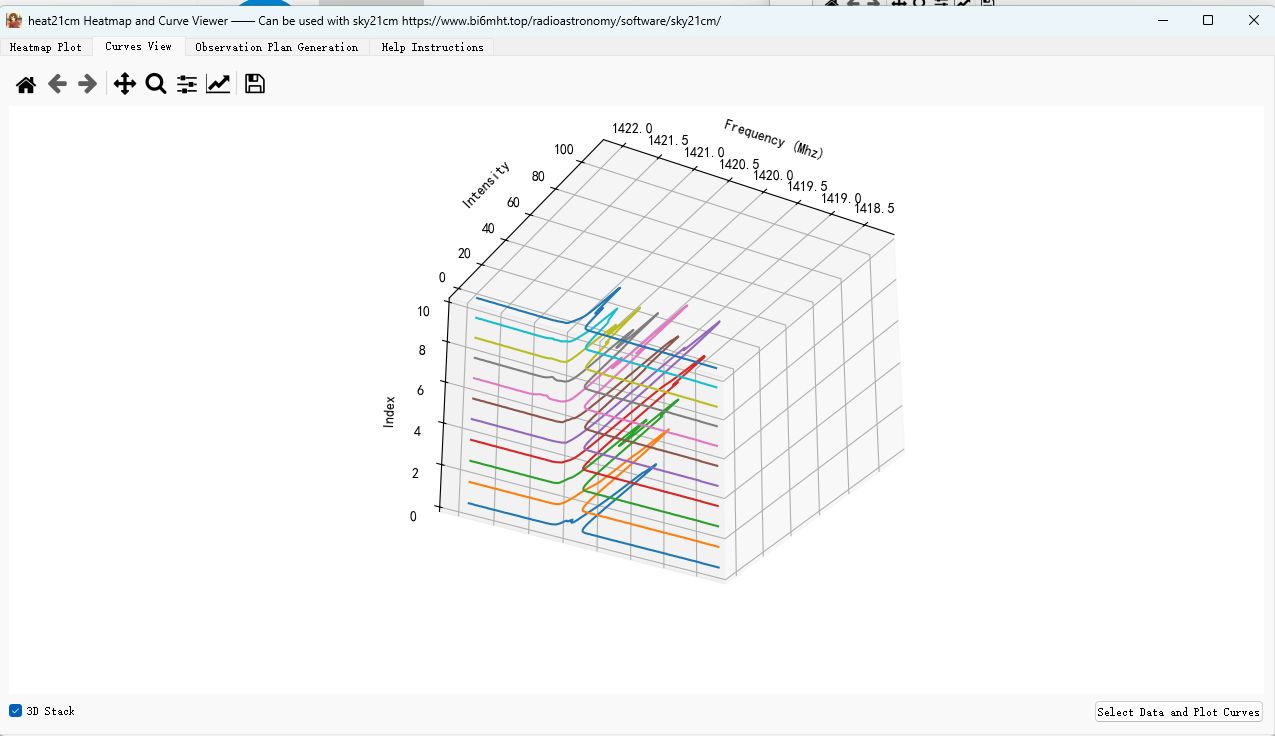
频谱文件查看 3D

# 使用说明
# 热力图绘制 Tab
-
参数设置:
- 在底部设置 X 像素、Y 像素(例如 3x3)
- 填写频谱下限 / 上限(单位 MHz,默认 1419 / 1421)
- 设置 "精细度 (插值倍数)":整数放大倍数,使热力图更细腻
-
数据选择:
- 点击 "选择数据并绘制热力图" 选择正好 x*y 个 txt 文件
- 文件必须命名为连续的数字:1.txt,2.txt,...,N.txt(程序会验证)
- 文件格式要求:
- 第一列为频率,第二列为强度
- 以 # 开头的行会被自动跳过
- 空行和只有一列的行也会被跳过
-
数据处理:
- 程序对每个文件在指定频率区间 [下限,上限] 上对强度进行积分(数值积分)
- 积分结果作为该像素的值
-
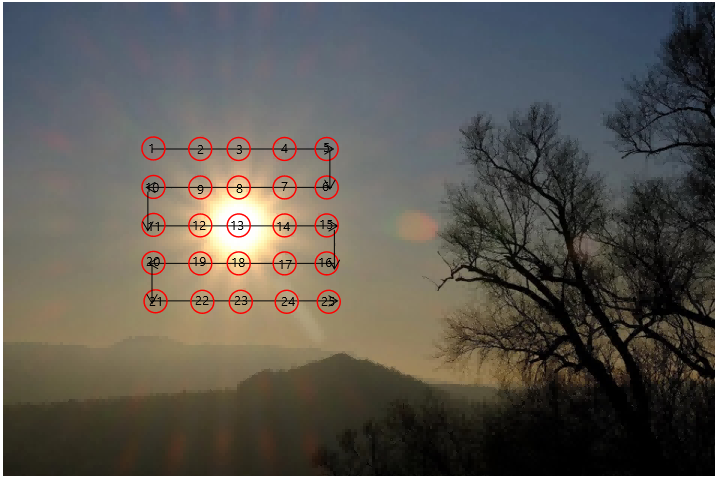
显示规则:
-
热力图的像素填充采用 "蛇形扫描" 规则,下图中的数字就是各文件的序号:
-
第一行从左到右
-
第二行从右到左
-
第三行再从左到右,以此类推
![image-20251001113758311]()
-
-
勾选 "3D 曲面" 可将热力图切换为三维曲面显示(立即切换)
-
# 曲线查看 Tab
-
数据选择:
- 点击 "选择数据并绘制曲线" 选择多个 txt 文件
- 文件可不按 1.txt.. 编号,程序会按选择顺序绘制
-
显示模式:
- 2D 模式:多条曲线叠加显示
- 3D 堆叠模式:每条曲线在不同的 z 上像纸片一样堆叠
- 切换立即生效
# 观测纲要生成 Tab
-
观测参数设置:
- 时区 (UTC+):例如中国填 8
- 经度 (°):默认 120
- 纬度 (°):默认 30
- 高度 (m):默认 50
- 起始时间:格式 YYYY-MM-DD HH:mm:ss
- 观测时间间隔 (s):默认 30,可为 0
-
扫描参数设置:
- 起始赤经、终止赤经,以及赤经总点数
- 起始赤纬、终止赤纬,以及赤纬总点数
- 程序会在指定范围内均匀生成点
-
文件导出:
- 点击 "导出观测纲要文件",选择保存位置(默认 set.txt)
- 生成蛇形扫描观测纲要文件
-
后续处理:
- 使用'sky21cm' 软件的 ' 根据观测纲要导出频谱文件 ' 按键来导入观测纲要文件
- 从而生成频谱文件
- 软件地址:https://www.bi6mht.top/radioastronomy/software/sky21cm/
# 观测纲要文件内容示例
8 # 时区
120 30 50 # 经度 纬度 海拔
1 20210120120000 0 -30 # 扫描序号(文件名) 时间 赤经 赤纬
2 20210120120030 2 -30
3 20210120120100 4 -30
4 20210120120130 4 -20
5 20210120120200 2 -20
6 20210120120230 0 -20
7 20210120120300 0 -10
8 20210120120330 2 -10
9 20210120120400 4 -10
10 20210120120430 4 0
11 20210120120500 2 0
12 20210120120530 0 0
... (蛇形扫描继续)
# 频谱文件格式与示例
可查看程序同目录下 'data/hydrogenLine' 中 txt 频谱文件;其中的观测纲要文件 set.txt 由 heat21cm 的 ' 观测纲要生成 'tab 制作,采用了其默认值,赤经范围为 75 - 105°(采样点 11 个),赤纬范围为 30 - -30°(采样点 21 个);然后 set.txt 被导入 sky21cm 软件生成这些频谱
每个 txt 频谱文件示例(空格或制表符分隔)(频率单位默认 MHz):
# 注释行会被跳过
1420.000 1.234
1420.100 1.567
...
# 实现原理(简要)
-
热力图生成:
- 对每个像素(对应一个 txt 文件)读取频谱
- 按频率区间积分得到像素强度
- 根据用户指定的 x,y 以及蛇形填充规则生成二维矩阵并显示为热力图
- 插值(精细度)用于将矩阵放大并(若可用)使用平滑插值提高视觉效果
-
曲线查看:
- 直接绘制强度 - 频率曲线
- 3D 模式将每条曲线绘制在不同 z 上以便对比
-
观测纲要生成:
- 通过用户输入的参数生成赤经赤纬扫描点
- 按时间顺序输出观测计划文件
# 注意事项
- 确保热力图所选文件数量严格等于 x*y,并且文件名为 1,2,...,N,否则程序会报警告
- 若数据频率点稀疏或积分区间没有包含任何点,积分结果将为 0
- 观测纲要生成导出成功 / 失败会有弹窗提示
# English
Gitee Download Link (Zip file includes sample data): https://gitee.com/BI6MHT/milky-way/releases/tag/heat21cm_v1.0
Github Download Link (Zip file includes sample data): https://github.com/BI6MHT/MilkyWay/releases/tag/heat21cm_v1.0
Baidu Cloud Download Link (Zip file includes sample data): Link: https://pan.baidu.com/s/1I4_mav3R0l5Cp-TxCmbZPA?pwd=wyvm Extraction code: wyvm
Google Drive Download Link: https://drive.google.com/drive/folders/19zmq4YT6A4KnOzxtBIn0LwSbEksrK0qR?usp=drive_link
Click heat21cm Sample Data to download (Sample data only)
# Some Showcases
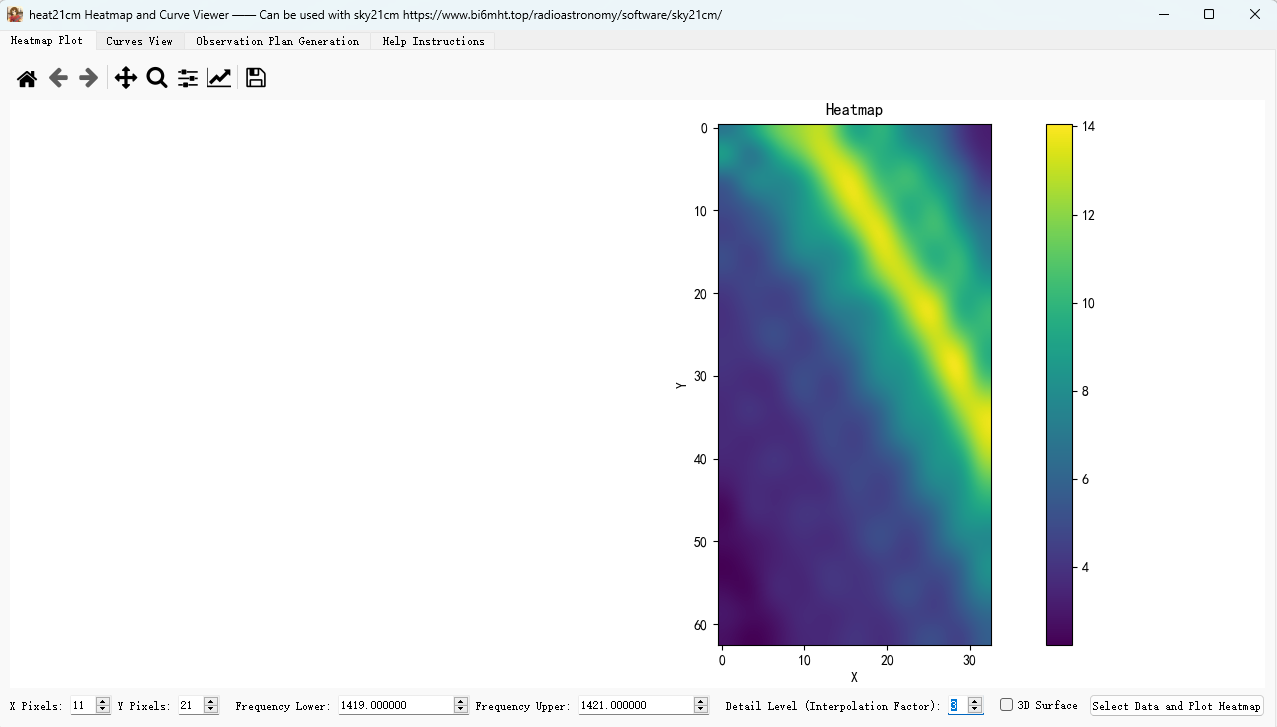
2D Heatmap
3D Heatmap
Observation Plan File Generation
Spectrum File Viewing (2D)
Spectrum File Viewing (3D)
# Instructions
# Heatmap Plot Tab
-
Parameter Settings:
- Set X Pixels, Y Pixels at the bottom (e.g., 3x3)
- Fill in Frequency Lower/Upper (unit MHz, default 1419 / 1421)
- Set "Detail Level (Interpolation Factor)": Integer magnification factor to make the heatmap more detailed
-
Data Selection:
- Click "Select Data and Plot Heatmap" to select exactly x*y txt files
- Files must be named with consecutive numbers: 1.txt, 2.txt, ..., N.txt (program will verify)
- File Format Requirements:
- First column: frequency, Second column: intensity
- Lines starting with # are automatically skipped
- Empty lines and lines with only one column are also skipped
-
Data Processing:
- The program performs numerical integration of the intensity over the specified frequency range [Lower, Upper] for each file
- The integration result becomes the value for that pixel
-
Display Rules:
-
Heatmap pixel filling uses a "snake scan" rule. The numbers in the figure below represent the file sequence numbers:
-
First row: left to right
-
Second row: right to left
-
Third row: left to right again, and so on.
![image-20251001113758311]()
-
-
Check "3D Surface" to switch the heatmap to a 3D surface display (takes effect immediately)
-
# Curves View Tab
-
Data Selection:
- Click "Select Data and Plot Curves" to select multiple txt files
- Files do not need to be numbered like 1.txt..; the program will plot in the selection order
-
Display Modes:
- 2D Mode: Multiple curves overlaid
- 3D Stack Mode: Each curve is stacked on a different z-level, like sheets of paper
- Switching takes effect immediately
# Observation Plan Generation Tab
-
Observation Parameter Settings:
- Timezone (UTC+): e.g., China is 8
- Longitude (°): Default 120
- Latitude (°): Default 30
- Altitude (m): Default 50
- Start Time: Format YYYY-MM-DD HH:mm:ss
- Observation Interval (s): Default 30, can be 0
-
Scan Parameter Settings:
- Start RA, End RA, and RA Total Points
- Start Dec, End Dec, and Dec Total Points
- The program generates evenly spaced points within the specified range
-
File Export:
- Click "Export Observation Plan File", choose a save location (default set.txt)
- Generates a snake scan observation plan file
-
Subsequent Processing:
- Use the 'Export Spectrum Files According to Observation Plan' button in the 'sky21cm' software to import the observation plan file
- This generates the spectrum files
- Software address: https://www.bi6mht.top/radioastronomy/software/sky21cm/
# Observation Plan File Content Example
8 # Timezone
120 30 50 # Longitude Latitude Altitude
1 20210120120000 0 -30 # scanIndex(fileName) Time RA Dec
2 20210120120030 2 -30
3 20210120120100 4 -30
4 20210120120130 4 -20
5 20210120120200 2 -20
6 20210120120230 0 -20
7 20210120120300 0 -10
8 20210120120330 2 -10
9 20210120120400 4 -10
10 20210120120430 4 0
11 20210120120500 2 0
12 20210120120530 0 0
... (Snake scan continues)
# Spectrum File Format and Example
You can view the txt spectrum files in the 'data/hydrogenLine' directory under the program's main folder. The observation plan file set.txt there was created by the 'Observation Plan Generation' tab in heat21cm using its default values: RA range 75 - 105° (11 sampling points), Dec range 30 - -30° (21 sampling points). Then set.txt was imported into the sky21cm software to generate these spectrum files.
Each txt spectrum file example (space or tab separated) (frequency unit default MHz):
# Comment lines are skipped
1420.000 1.234
1420.100 1.567
...
# Implementation Principle (Brief)
-
Heatmap Generation:
- Read the spectrum for each pixel (corresponding to one txt file)
- Integrate over the frequency range to get the pixel intensity
- Generate a 2D matrix according to the user-specified x, y and snake fill rule, and display it as a heatmap
- Interpolation (Detail Level) is used to enlarge the matrix and (if available) use smooth interpolation to improve the visual effect
-
Curves Viewing:
- Directly plot intensity-frequency curves
- 3D mode plots each curve on a different z-level for easy comparison
-
Observation Plan Generation:
- Generate RA/Dec scan points based on user-input parameters
- Output the observation plan file in chronological order
# Notes
- Ensure the number of files selected for the heatmap strictly equals x*y, and the file names are 1, 2, ..., N, otherwise the program will issue a warning.
- If the data frequency points are sparse or the integration range contains no points, the integration result will be 0.
- Success or failure of observation plan generation export will be indicated by a popup message.