The English version is presented in the second part of this article, You can click on the "English" tab in the left sidebar to jump to the English version.
# 中文
Gitee 下载地址(压缩包含示例数据):https://gitee.com/BI6MHT/milky-way/releases/tag/sky21cm_v2.0
Github 下载地址(压缩包含示例数据):https://github.com/BI6MHT/MilkyWay/releases/tag/sky21cm_v2.0
百度云下载地址(压缩包含示例数据):链接: https://pan.baidu.com/s/1I4_mav3R0l5Cp-TxCmbZPA?pwd=wyvm 提取码: wyvm
谷歌云盘下载地址: https://drive.google.com/drive/folders/19zmq4YT6A4KnOzxtBIn0LwSbEksrK0qR?usp=drive_link
点击示例数据下载(单独一个示例数据)
# 示例图

# 从 LSR 修正到观测者的正确性验证
下图是在湖北十堰用 0.75m 小天线观测的若干数据(蓝色)和 LAB HI Survey 数据(黑色,已从 LSR 修正到观测者位置),可见基本吻合,示例数据已经包含在软件压缩包中,说明如下:
- data1:湖北十堰利用 75cm 栅格抛物面的观测数据,地理位置:116.59649 35.4082 48 # 分别为 纬度 (°) 海拔 (m)
- data2: 利用 LAB HI Survey (Kalberla et al., 2005) 巡天数据库推导出,在湖北十堰同样时刻的观测数据
- data3: 利用 LAB HI Survey (Kalberla et al., 2005) 巡天数据库推导出,在湖北十堰固定时刻扫描银盘(银经 0-360°,每隔 5° 扫描一次)的观测数据

# 简要说明
-
关于版本的更新可见于 https://www.bi6mht.top/radioastronomy/software/sky21cm/
-
可结合虚拟天文馆 (stellarium) 使用
-
21 cm HI 线来自中性氢自旋翻转跃迁,静止频率约 1420.40575177 MHz。
-
多普勒效应会使发射频率随着径向速度发生偏移,f = f0*(1 - v/c)(非相对论近似)。
-
巡天数据以 LSR 参考系给出,观测者在地球上需考虑太阳运动和地球公转 / 自转引入的修正(可选)
-
巡天数据来自 LAB HI Survey (Kalberla et al., 2005),访问网址为 https://cdsarc.cds.unistra.fr/ftp/VIII/76/, 软件采用了 lab2.fit 文件,如果用其他文件,更名为 lab2.fit 置于程序同目录下就可以
-
输入参数范围说明:
- 赤经 RA:0 ~ 360 度。
- 赤纬 Dec:-90 ~ +90 度。
- 经度 lon:-180 ~ +180 度(或 0 ~ 360,取决习惯)。
- 纬度 lat:-90 ~ +90 度(北为正)。
- 方位角 az(水平方位 / 方位角):0 ~ 360 度(0 = 北 / 视习惯,本程序按用户输入解释)。
- 高度角 alt(天顶角 / 高度角):-90 ~ +90 度;通常望远镜可观测范围为 0 ~ +90 度。
- 银经 l:0 ~ 360 度
- 银纬 b:-90 ~ 90 度
# 使用方法
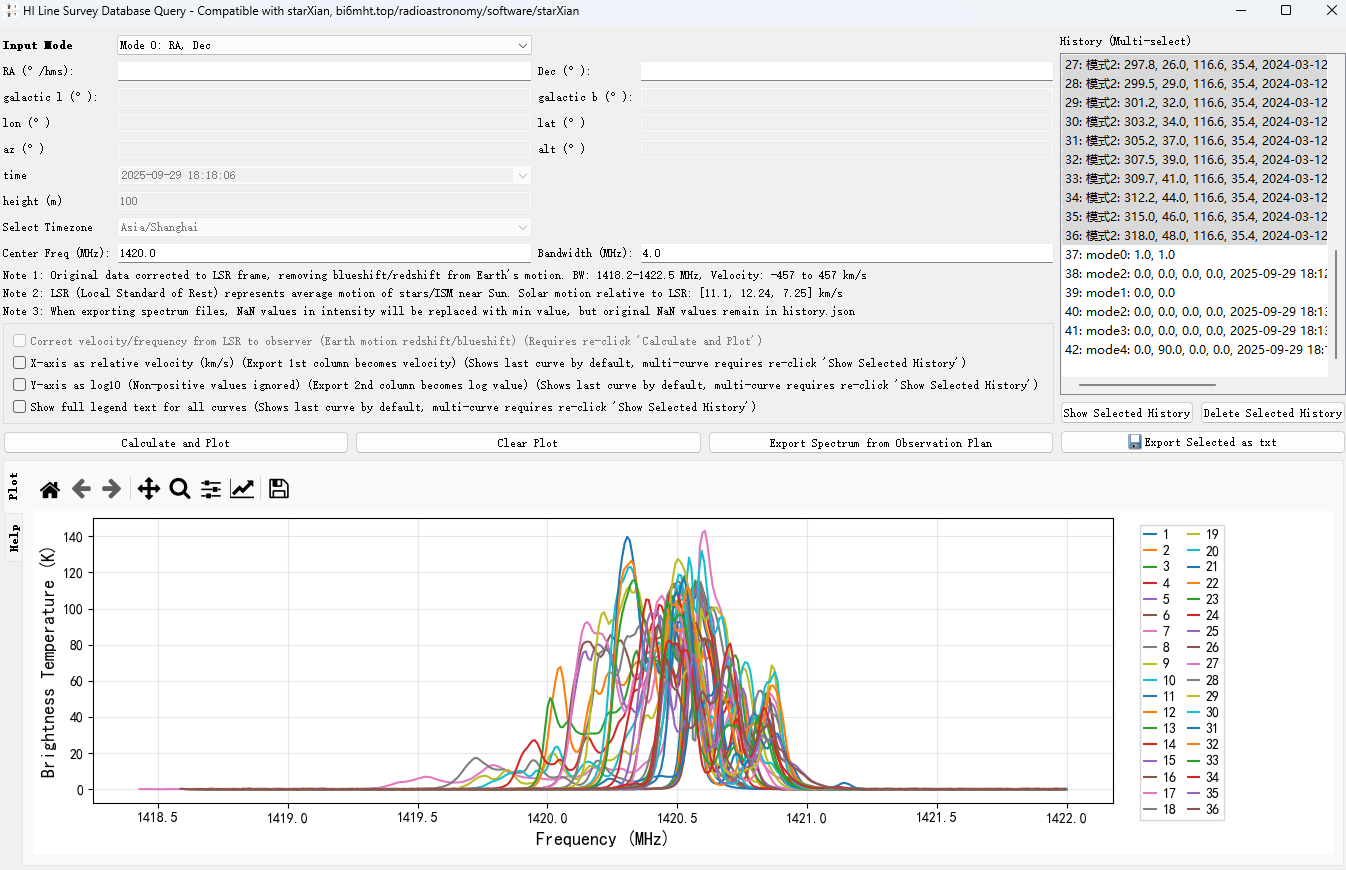
- 选择输入模式(不同模式下的曲线图例名称即为对应的参数值,例如模式 2 下,图例的名称即为 ' 模式 2: 赤纬、赤纬、经度、纬度、时间 ')
- 模式 0: 赤经、赤纬;
- 模式 1: 银经、银纬;
- 模式 2: 赤纬、赤纬、经度、纬度、时间;
- 模式 3: 银经、银纬、经度、纬度、时间;
- 模式 4: 方位角、高度角、经度、纬度、时间;
-
若使用模式 2、模式 3、模式 4,先在 “选择时区” 下拉框中选择对应本地时区(默认 Asia/Shanghai),然后在 “time” 栏输入该时区的当地时间,例如:2025-09-13 20:10:02 。程序会把该本地时间转换为 UTC 再执行速度修正 / 坐标转换。
-
可选择启用速度修正(仅模式 2、模式 3、模式 4 有效)、横坐标显示为速度、纵轴使用 log10 显示(非正值将被忽略)。
-
点击 “计算并绘制”。历史记录会保存在本地 history.json,下次启动会恢复。
-
在历史列表中多选可以绘制或删除条目,并可导出为 txt 文件。txt 文件的第一行以 #开头,后面跟随文件名(不含后缀)、时间(仅模式 2、模式 3、模式 4 有)、赤经、赤纬
# 根据观测纲要文件导出频谱文件
这是针对软件 starXian 添加的功能,可参考本软件内观测纲要文件的写法,见于 example_data\data1\set.txt;在 starXian 中也含有该数据。
# 赞助
如果有兴趣,也可以赞助我一瓶可乐的钱,可访问我的个人博客 https://www.bi6mht.top,在任意文章的最下方点击 Donate
# English
Gitee Download Link (Archive includes sample data): https://gitee.com/BI6MHT/milky-way/releases/tag/sky21cm_v2.0
Github Download Link (Archive includes sample data): https://github.com/BI6MHT/MilkyWay/releases/tag/sky21cm_v2.0
Baidu Cloud Download Link (Archive includes sample data): Link: https://pan.baidu.com/s/1I4_mav3R0l5Cp-TxCmbZPA?pwd=wyvm Extraction code: wyvm
Google Drive Download: https://drive.google.com/drive/folders/19zmq4YT6A4KnOzxtBIn0LwSbEksrK0qR?usp=drive_link
Click Sample Data to download (Sample data file only)
# Example Image
# Verification of Accuracy for LSR to Observer Correction
The figure below shows several observational data points (in blue) taken with a 0.75m small antenna in Shiyan, Hubei, compared with LAB HI Survey data (in black, corrected from LSR to observer position). The basic agreement is visible. The sample data is included in the software package, with the following descriptions:
- data1: Observation data from Shiyan, Hubei using a 75cm grid parabolic antenna. Location: 116.59649 35.4082 48 # representing longitude(°) latitude(°) elevation(m)
- data2: Data derived from the LAB HI Survey (Kalberla et al., 2005) database for the same observation time in Shiyan, Hubei
- data3: Data derived from the LAB HI Survey (Kalberla et al., 2005) database, showing a scan of the galactic plane (galactic longitude 0-360°, scanned every 5°) at a fixed time in Shiyan, Hubei
# Brief Description
-
Can be used in conjunction with Stellarium.
-
Version updates available at: https://www.bi6mht.top/radioastronomy/software/sky21cm/
-
The 21 cm HI line originates from the spin-flip transition of neutral hydrogen, with a rest frequency of approximately 1420.40575177 MHz.
-
The Doppler effect causes the emission frequency to shift based on the radial velocity, f = f0*(1 - v/c) (non-relativistic approximation).
-
The survey data is provided in the LSR reference frame. Observers on Earth need to consider corrections introduced by solar motion and Earth's revolution/rotation (optional).
-
The survey data comes from the LAB HI Survey (Kalberla et al., 2005), accessible at https://cdsarc.cds.unistra.fr/ftp/VIII/76/. The software uses the
lab2.fitfile. If using other files, rename them tolab2.fitand place them in the same directory as the program. -
Input Parameter Ranges:
- Right Ascension (RA): 0 ~ 360 degrees.
- Declination (Dec): -90 ~ +90 degrees.
- Longitude (lon): -180 ~ +180 degrees (or 0 ~ 360, depending on convention).
- Latitude (lat): -90 ~ +90 degrees (North is positive).
- Azimuth (az): 0 ~ 360 degrees (0=North, interpretation depends on user input/convention).
- Altitude (alt): -90 ~ +90 degrees; typically, the observable range for telescopes is 0 ~ +90 degrees.
- Galactic Longitude (l): 0 ~ 360 degrees.
- Galactic Latitude (b): -90 ~ 90 degrees.
# Usage Instructions
-
Select the input mode (The legend name in the plot for different modes corresponds to the parameter values used. For example, in Mode 2, the legend name is 'Mode2: RA, Dec, Lon, Lat, Time').
- Mode 0: Right Ascension, Declination.
- Mode 1: Galactic Longitude, Galactic Latitude.
- Mode 2: Right Ascension, Declination, Longitude, Latitude, Time.
- Mode 3: Galactic Longitude, Galactic Latitude, Longitude, Latitude, Time.
- Mode 4: Azimuth, Altitude, Longitude, Latitude, Time.
-
If using Mode 2, Mode 3, or Mode 4, first select the corresponding local time zone from the "Select Timezone" dropdown (default is Asia/Shanghai). Then, enter the local time for that time zone in the "time" field, e.g.,
2025-09-13 20:10:02. The program will convert this local time to UTC before performing velocity corrections/coordinate conversions. -
You can choose to enable velocity correction (only valid for Modes 2, 3, 4), display the horizontal axis as velocity, and use a log10 scale for the vertical axis (non-positive values will be ignored).
-
Click "Calculate and Plot". The history is saved locally in
history.jsonand will be restored upon the next startup. -
Multiple selections can be made in the history list to plot or delete entries, and they can be exported as a txt file. The first line of the txt file starts with
#, followed by the filename (without extension), time (only for Modes 2, 3, 4), Right Ascension, and Declination.
# Export Spectrum Files Based on Observation Schedule File
This feature was added specifically for the software starXian. Please refer to the format of the observation schedule file within this software, found in example_data\data1\set.txt ; starXian also contains this data.
# Sponsorship
If you're interested, you can sponsor me the price of a cola. Visit my personal blog at https://www.bi6mht.top and click Donate at the bottom of any article.