The English version is presented in the second part of this article, You can click on the "English" tab in the left sidebar to jump to the English version.
# 中文
Gitee 下载地址(压缩包含示例数据):https://gitee.com/BI6MHT/milky-way/releases/tag/StarXian_v2.0
Github 下载地址(压缩包含示例数据):https://github.com/BI6MHT/MilkyWay/releases/tag/starXian_v2.0
百度云下载地址(压缩包含示例数据):链接: https://pan.baidu.com/s/1I4_mav3R0l5Cp-TxCmbZPA?pwd=wyvm 提取码: wyvm
谷歌云盘下载地址: https://drive.google.com/drive/folders/19zmq4YT6A4KnOzxtBIn0LwSbEksrK0qR?usp=drive_link
点击示例数据下载(单独一个示例数据)
# 一些信息
starXian:星星拨弦的意思,人类弹琴会发出声波,星星弹琴会发出电磁波,英文 star 和中文 “弦(Xian)” 合在一起,可结合 sky21cm 使用
| 内容 | 说明 |
|---|---|
| 氢原子绘制银河系的原理 | https://www.bi6mht.top/radioastronomy/theory/ 氢谱线绘制银河的原理 / |
| 最初的 python 源码 | https://www.bi6mht.top/radioastronomy/theory/ 氢谱线数据处理 / |
| 版本的更新 | https://www.bi6mht.top/radioastronomy/software/starXian/ |
| QQ 交流群 | 926020514 |
# 处理的对象
该应用是用来处理银河系银盘上的氢谱线的,所以频谱数据对应的指向应当在银盘附近
频谱数据格式为 Sdrsharp 的 IF Average 插件输出的频谱文件,关于 IF Average 可参考 https://www.bi6mht.top/radioastronomy/software/ 频谱的积分平均 /
银盘所对应的赤经赤纬数据如下所示
| 银经 | 赤经 (hms) | 赤纬 (dms) |
|---|---|---|
| 0 | 17h45m37s | -28d56m10s |
| 5 | 17h57m04s | -24d38m18s |
| 10 | 18h07m45s | -20d17m24s |
| 15 | 18h17m51s | -15d54m12s |
| 20 | 18h27m31s | -11d29m19s |
| 25 | 18h36m53s | -07d03m16s |
| 30 | 18h46m05s | -02d36m32s |
| 35 | 18h55m12s | +01d50m25s |
| 40 | 19h04m22s | +06d17m13s |
| 45 | 19h13m42s | +10d43m25s |
| 50 | 19h23m18s | +15d08m32s |
| 55 | 19h33m19s | +19d32m04s |
| 60 | 19h43m54s | +23d53m25s |
| 65 | 19h55m12s | +28d11m52s |
| 70 | 20h07m27s | +32d26m32s |
| 75 | 20h20m55s | +36d36m20s |
| 80 | 20h35m53s | +40d39m48s |
| 85 | 20h52m45s | +44d35m07s |
| 90 | 21h12m01s | +48d19m46s |
| 95 | 21h34m13s | +51d50m30s |
| 100 | 22h00m00s | +55d02m59s |
| 105 | 22h29m59s | +57d51m37s |
| 110 | 23h04m31s | +60d09m34s |
| 115 | 23h43m28s | +61d49m14s |
| 120 | 00h25m48s | +62d43m32s |
| 125 | 01h09m32s | +62d47m56s |
| 130 | 01h52m17s | +62d02m01s |
| 135 | 02h31m55s | +60d29m44s |
| 140 | 03h07m15s | +58d17m51s |
| 145 | 03h37m59s | +55d34m00s |
| 150 | 04h04m28s | +52d25m12s |
| 155 | 04h27m14s | +48d57m17s |
| 160 | 04h46m58s | +45d14m46s |
| 165 | 05h04m13s | +41d21m06s |
| 170 | 05h19m29s | +37d18m53s |
| 175 | 05h33m10s | +33d10m05s |
| 180 | 05h45m37s | +28d56m10s |
| 185 | 05h57m04s | +24d38m18s |
| 190 | 06h07m45s | +20d17m24s |
| 195 | 06h17m51s | +15d54m12s |
| 200 | 06h27m31s | +11d29m19s |
| 205 | 06h36m53s | +07d03m16s |
| 210 | 06h46m05s | +02d36m32s |
| 215 | 06h55m12s | -01d50m25s |
| 220 | 07h04m22s | -06d17m13s |
| 225 | 07h13m42s | -10d43m25s |
| 230 | 07h23m18s | -15d08m32s |
| 235 | 07h33m19s | -19d32m04s |
| 240 | 07h43m54s | -23d53m25s |
| 245 | 07h55m12s | -28d11m52s |
| 250 | 08h07m27s | -32d26m32s |
| 255 | 08h20m55s | -36d36m20s |
| 260 | 08h35m53s | -40d39m48s |
| 265 | 08h52m45s | -44d35m07s |
| 270 | 09h12m01s | -48d19m46s |
| 275 | 09h34m13s | -51d50m30s |
| 280 | 10h00m00s | -55d02m59s |
| 285 | 10h29m59s | -57d51m37s |
| 290 | 11h04m31s | -60d09m34s |
| 295 | 11h43m28s | -61d49m14s |
| 300 | 12h25m48s | -62d43m32s |
| 305 | 13h09m32s | -62d47m56s |
| 310 | 13h52m17s | -62d02m01s |
| 315 | 14h31m55s | -60d29m44s |
| 320 | 15h07m15s | -58d17m51s |
| 325 | 15h37m59s | -55d34m00s |
| 330 | 16h04m28s | -52d25m12s |
| 335 | 16h27m14s | -48d57m17s |
| 340 | 16h46m58s | -45d14m46s |
| 345 | 17h04m13s | -41d21m06s |
| 350 | 17h19m29s | -37d18m53s |
| 355 | 17h33m10s | -33d10m05s |
# 示例数据的使用
示例数据已经包含在软件压缩包中,说明如下:
- data1:湖北十堰利用 75cm 栅格抛物面的观测数据,地理位置:116.59649 35.4082 48 # 分别为 纬度 (°) 海拔 (m)
- data2: 利用 LAB HI Survey (Kalberla et al., 2005) 巡天数据库推导出,在湖北十堰同样时刻的观测数据
- data3: 利用 LAB HI Survey (Kalberla et al., 2005) 巡天数据库推导出,在湖北十堰固定时刻扫描银盘(银经 0-360°,每隔 5° 扫描一次)的观测数据
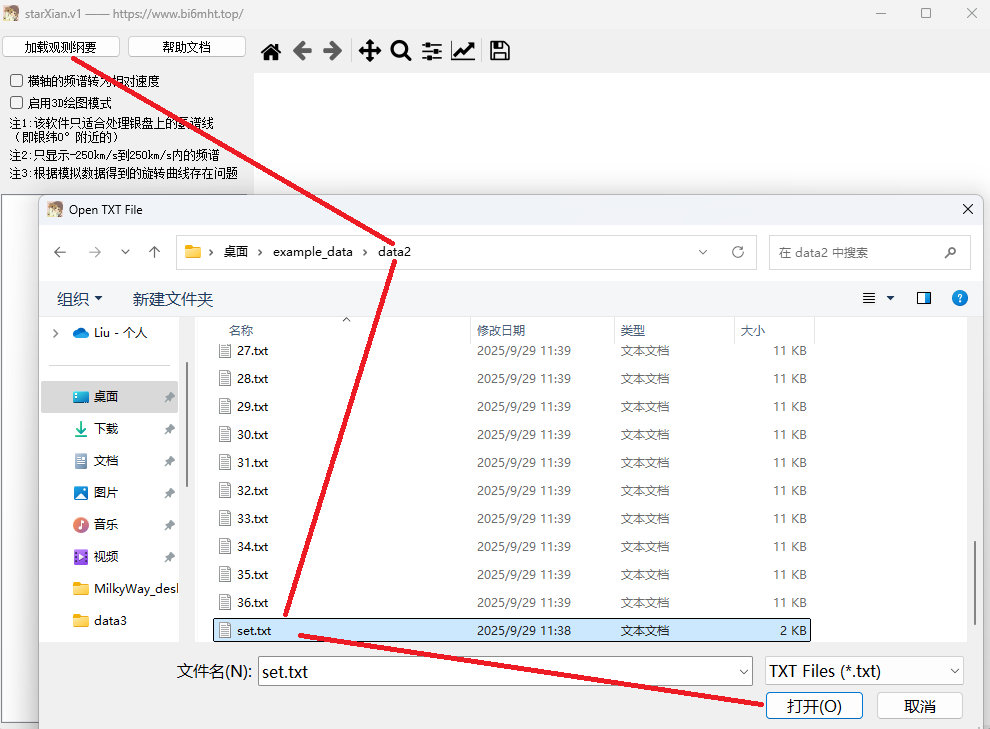
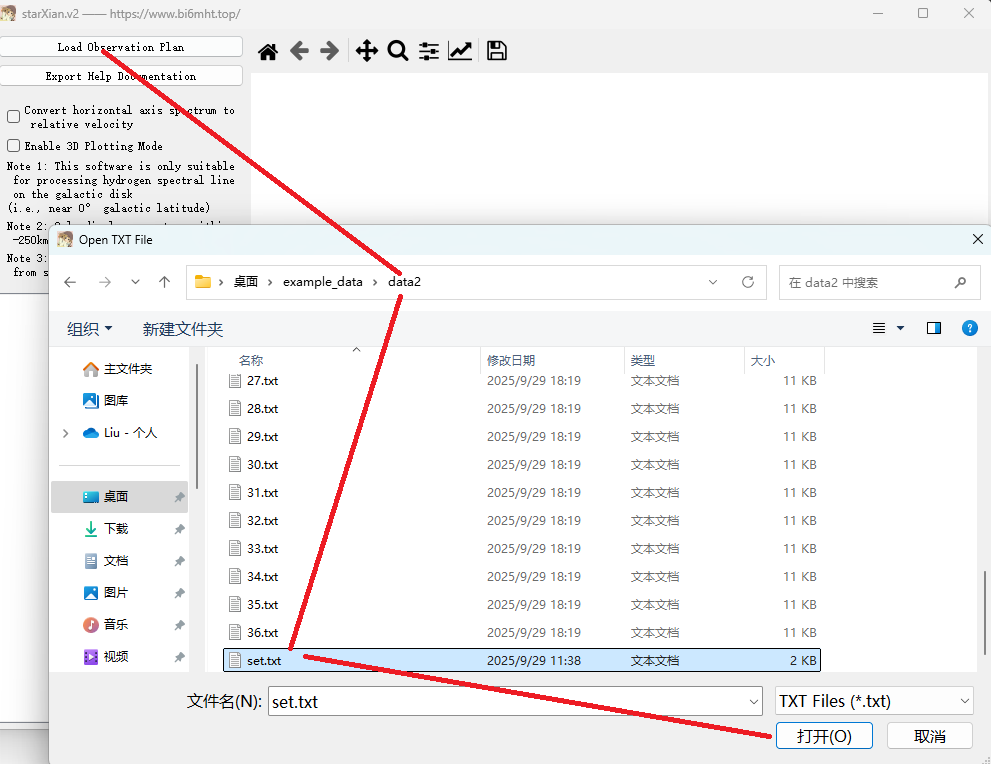
打开软件,点击加载观测纲要文件,选中示例数据 data2 文件夹中的 set.txt,如下图所示
加载后会出现若干选项,如下图所示,分别为银河系旋臂详图、简图(只画出了旋臂散点)、旋转曲线、每个文件频谱图的绘制,点击即可显示出来;也可以右击绿框内的控件,对图片进行放大、存储、复原等操作。
旋臂有两种解,哪个看起来合理就是对的,示例数据中显然第一种解是正确的
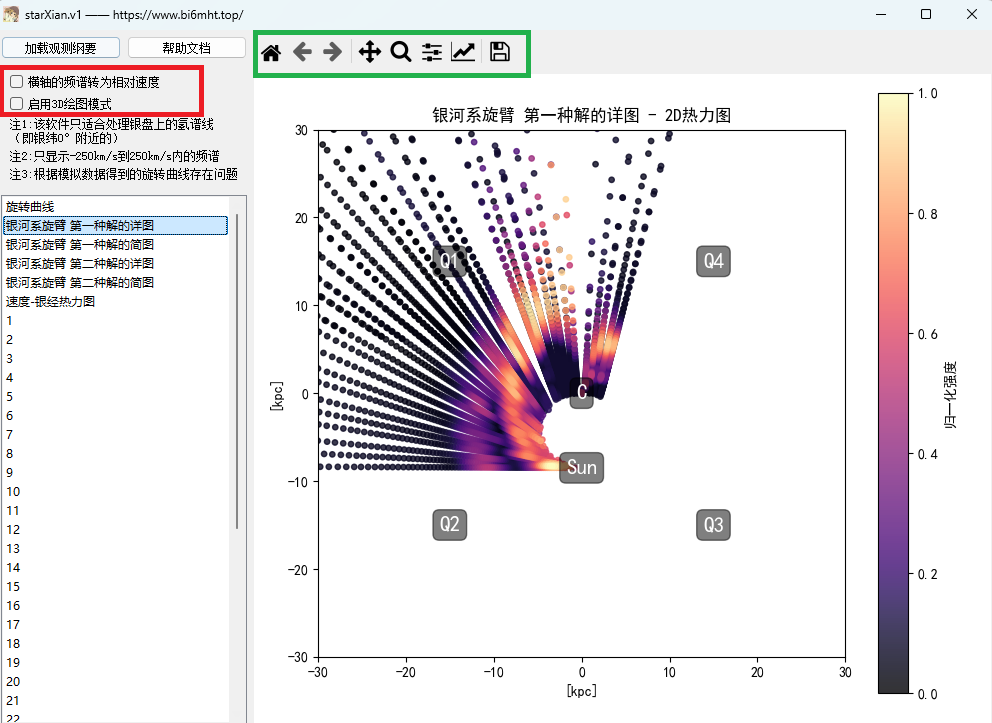
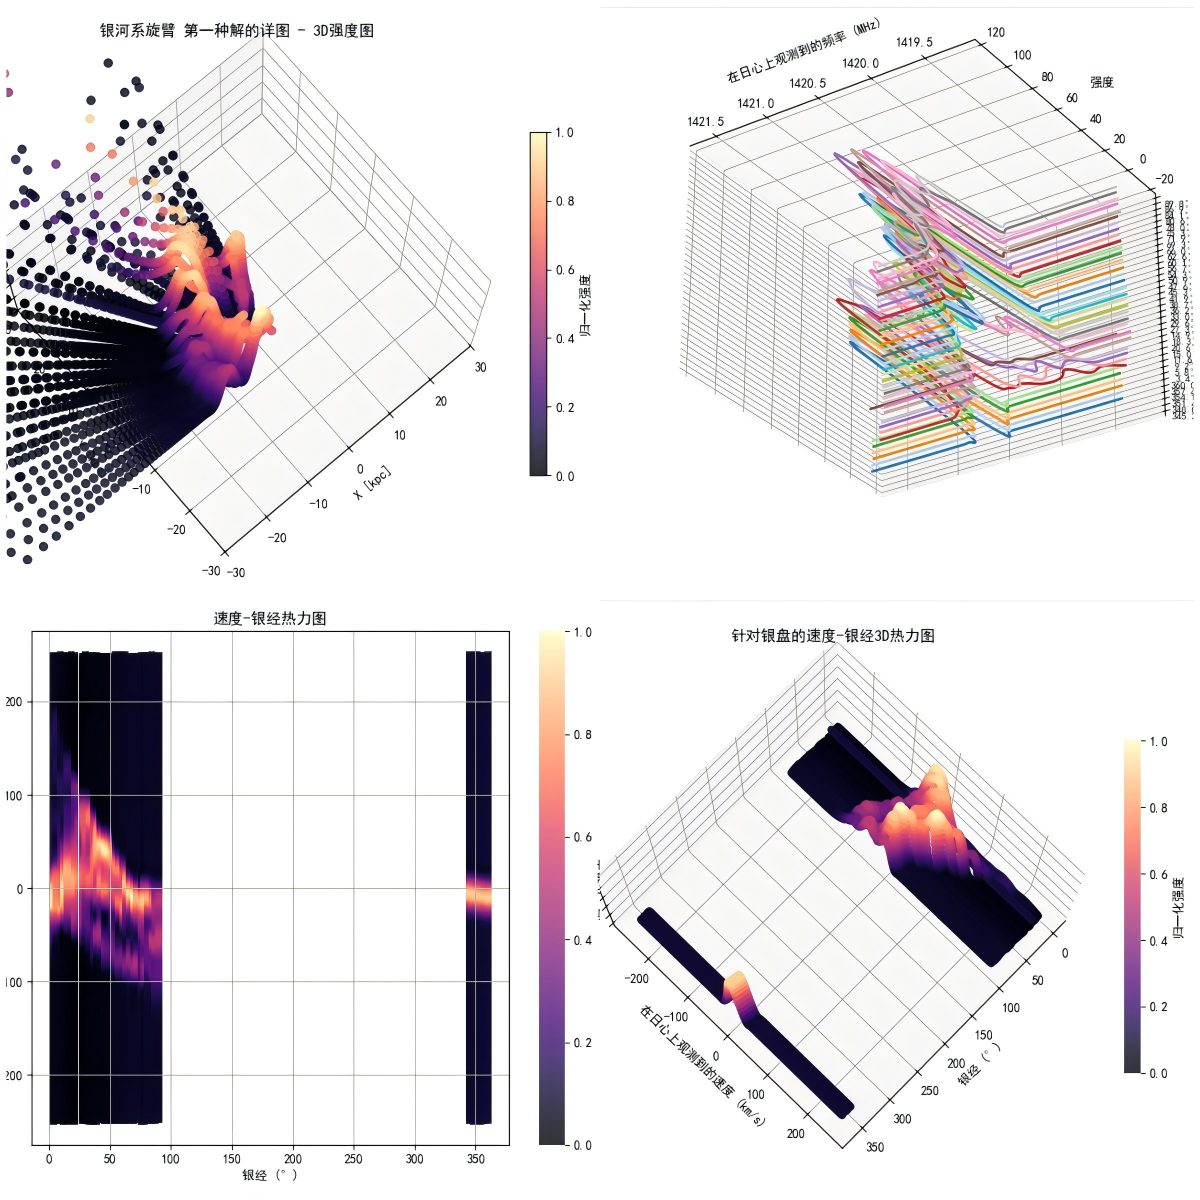
红框内的内容也可以尝试一下,一些图片展示如下:
# 创建数据
# 创建新文件夹
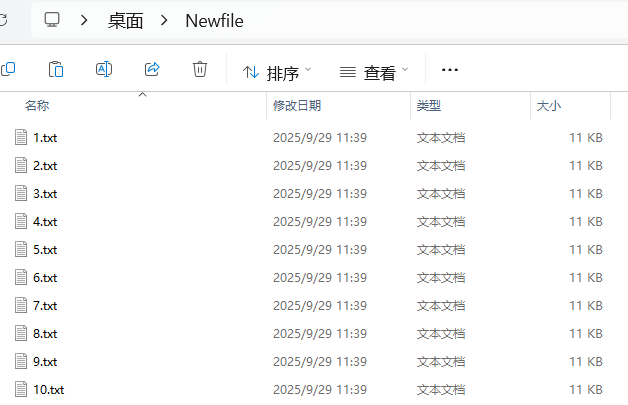
创建一个新建文件夹,任意命名,例如 Newfile,如下图所示

# 复制频谱文件
先记录下 IF average 导出的每个频谱文件对应的观测时间(文件创建时间或者修改时间)和指向的赤经赤纬
按照观测时间顺序(或者银经的次序)把频谱文件依次命名为 1.txt、2.txt、3.txt、4.txt...(比较随意,也可命名为 curve_1_freq.txt、curve_2_freq.txt、curve_3_freq.txt... 之类的),然后复制到 Newfile 文件夹中
在观测时想要了解指向的赤经赤纬可以使用星座盘,可参考 https://www.bi6mht.top/radioastronomy/software/ 星座盘 /
关于赤经赤纬的概念可见于 https://www.bi6mht.top/radioastronomy/manual/ 定位射电源在天空中的位置(赤经和赤纬)/ ,可以去 B 站查询一些视频,那样比较直观
把频谱文件复制到 Newfile 文件中
# 创建观测纲要文件
在 Newfile 中创建一个 txt 文本文件,可以命名为 set 或者其他名字,如下图所示;这是一个观测纲要文件,记录着观测者所在的位置和频谱信息

# 添加观测位置
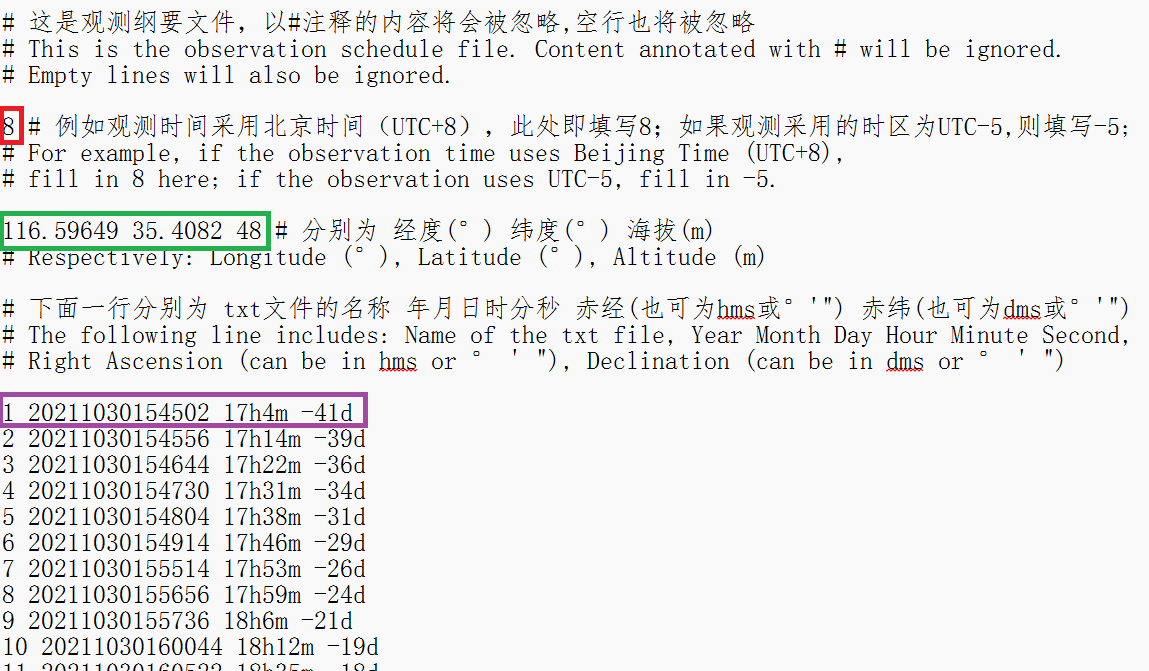
#开头的行将会被忽略
在观测纲要文件开头行 (红色) 添加时区信息,例如观测时间采用北京时间(UTC+8),此处即填写 8;如果观测采用的时区为 UTC-5, 则填写 - 5
在观测纲要文件第二行 (绿色) 添加观测者所在位置,即经度 (°)、维度 (°)、海拔 (m)
可尝试在 https://jingweidu.bmcx.com/, 查询观测所在市的经纬度,海拔如果不知道可以任意设定为 50m
# 添加频谱信息
下面观察紫色框圈出的信息
'1' 这个字符代表该频谱文件为 '1.txt'
'20211030154502' 代表 '1' 频谱是在 2021 年 10 月 30 日 15 点 14 分 02 秒观测得到的(由于刚才第一行填写的是 8,即 UTC+8,此处为北京时间)
'17h4m' 即指向的赤经值,也可等价写 '256'、'256°00'00"'、'256d';'-41d' 表示即指向的赤纬,也可等价写为 '-41'、'-41d00m00s'、'-41°00'00"' 之类的,建议直接看星座盘里的赤经赤纬,然后填入
填写时注意空格
按照这种格式填写之后的行,直到所有频谱文件的信息都填充完毕
逐行添加频谱信息
# 赞助
如果有兴趣,也可以赞助我一瓶可乐的钱,可访问我的个人博客 https://www.bi6mht.top,在任意文章的最下方点击 Donate
# English
Gitee Download (zip includes sample data): https://gitee.com/BI6MHT/milky-way/releases/tag/StarXian_v2.0
Github Download (zip includes sample data): https://github.com/BI6MHT/MilkyWay/releases/tag/starXian_v2.0
Baidu Cloud Download (zip includes sample data): Link: https://pan.baidu.com/s/1I4_mav3R0l5Cp-TxCmbZPA?pwd=wyvm Extraction code: wyvm
Google Drive Download: https://drive.google.com/drive/folders/19zmq4YT6A4KnOzxtBIn0LwSbEksrK0qR?usp=drive_link
Click Sample Data to download (sample data only)
# Some Information
starXian: Meaning "stars plucking strings" - humans playing instruments produce sound waves, while stars "playing instruments" emit electromagnetic waves. Combines English "star" and Chinese "弦 (Xian)". Can be used with sky21cm
| Content | Description |
|---|---|
| Principle of using hydrogen atoms to map the Milky Way | https://www.bi6mht.top/radioastronomy/theory/ 氢谱线绘制银河的原理 / |
| Original Python source code | https://www.bi6mht.top/radioastronomy/theory/ 氢谱线数据处理 / |
| Version updates | https://www.bi6mht.top/radioastronomy/software/starXian/ |
| QQ discussion group | 926020514 |
# Processing Target
This application is used to process hydrogen spectral lines on the galactic disk of the Milky Way, so the spectral data should correspond to directions near the galactic plane.
The spectral data format is the spectrum file output by Sdrsharp's IF Average plugin. For information about IF Average, refer to: https://www.bi6mht.top/radioastronomy/software/ 频谱的积分平均 /
The equatorial coordinates (Right Ascension and Declination) corresponding to the galactic plane are as follows:
| Galactic Longitude | Right Ascension(hms) | Declination(dms) |
|---|---|---|
| 0 | 17h45m37s | -28d56m10s |
| 5 | 17h57m04s | -24d38m18s |
| 10 | 18h07m45s | -20d17m24s |
| 15 | 18h17m51s | -15d54m12s |
| 20 | 18h27m31s | -11d29m19s |
| 25 | 18h36m53s | -07d03m16s |
| 30 | 18h46m05s | -02d36m32s |
| 35 | 18h55m12s | +01d50m25s |
| 40 | 19h04m22s | +06d17m13s |
| 45 | 19h13m42s | +10d43m25s |
| 50 | 19h23m18s | +15d08m32s |
| 55 | 19h33m19s | +19d32m04s |
| 60 | 19h43m54s | +23d53m25s |
| 65 | 19h55m12s | +28d11m52s |
| 70 | 20h07m27s | +32d26m32s |
| 75 | 20h20m55s | +36d36m20s |
| 80 | 20h35m53s | +40d39m48s |
| 85 | 20h52m45s | +44d35m07s |
| 90 | 21h12m01s | +48d19m46s |
| 95 | 21h34m13s | +51d50m30s |
| 100 | 22h00m00s | +55d02m59s |
| 105 | 22h29m59s | +57d51m37s |
| 110 | 23h04m31s | +60d09m34s |
| 115 | 23h43m28s | +61d49m14s |
| 120 | 00h25m48s | +62d43m32s |
| 125 | 01h09m32s | +62d47m56s |
| 130 | 01h52m17s | +62d02m01s |
| 135 | 02h31m55s | +60d29m44s |
| 140 | 03h07m15s | +58d17m51s |
| 145 | 03h37m59s | +55d34m00s |
| 150 | 04h04m28s | +52d25m12s |
| 155 | 04h27m14s | +48d57m17s |
| 160 | 04h46m58s | +45d14m46s |
| 165 | 05h04m13s | +41d21m06s |
| 170 | 05h19m29s | +37d18m53s |
| 175 | 05h33m10s | +33d10m05s |
| 180 | 05h45m37s | +28d56m10s |
| 185 | 05h57m04s | +24d38m18s |
| 190 | 06h07m45s | +20d17m24s |
| 195 | 06h17m51s | +15d54m12s |
| 200 | 06h27m31s | +11d29m19s |
| 205 | 06h36m53s | +07d03m16s |
| 210 | 06h46m05s | +02d36m32s |
| 215 | 06h55m12s | -01d50m25s |
| 220 | 07h04m22s | -06d17m13s |
| 225 | 07h13m42s | -10d43m25s |
| 230 | 07h23m18s | -15d08m32s |
| 235 | 07h33m19s | -19d32m04s |
| 240 | 07h43m54s | -23d53m25s |
| 245 | 07h55m12s | -28d11m52s |
| 250 | 08h07m27s | -32d26m32s |
| 255 | 08h20m55s | -36d36m20s |
| 260 | 08h35m53s | -40d39m48s |
| 265 | 08h52m45s | -44d35m07s |
| 270 | 09h12m01s | -48d19m46s |
| 275 | 09h34m13s | -51d50m30s |
| 280 | 10h00m00s | -55d02m59s |
| 285 | 10h29m59s | -57d51m37s |
| 290 | 11h04m31s | -60d09m34s |
| 295 | 11h43m28s | -61d49m14s |
| 300 | 12h25m48s | -62d43m32s |
| 305 | 13h09m32s | -62d47m56s |
| 310 | 13h52m17s | -62d02m01s |
| 315 | 14h31m55s | -60d29m44s |
| 320 | 15h07m15s | -58d17m51s |
| 325 | 15h37m59s | -55d34m00s |
| 330 | 16h04m28s | -52d25m12s |
| 335 | 16h27m14s | -48d57m17s |
| 340 | 16h46m58s | -45d14m46s |
| 345 | 17h04m13s | -41d21m06s |
| 350 | 17h19m29s | -37d18m53s |
| 355 | 17h33m10s | -33d10m05s |
# Using Sample Data
Sample data is already included in the software package. Descriptions:
- data1: Observation data from Shiyan, Hubei using 75cm grid parabolic antenna. Location: 116.59649 35.4082 48 # Respectively: Longitude(°) Latitude(°) Altitude(m)
- data2: Data derived from LAB HI Survey (Kalberla et al., 2005) database for the same observation time in Shiyan, Hubei
- data3: Data derived from LAB HI Survey (Kalberla et al., 2005) database, scanning the galactic plane (galactic longitude 0-360°, every 5°) at fixed times in Shiyan, Hubei
Open the software, click "Load Observation Plan File", select set.txt in the sample data data2 folder, as shown below:
After loading, several options will appear as shown below: detailed Milky Way spiral arms diagram, simplified diagram (only showing spiral arm scatter points), rotation curve, and spectrum plots for each file. Click to display them; you can also right-click the control in the green box to zoom, save, restore, etc.
There are two solutions for spiral arms - whichever looks reasonable is correct. In the sample data, clearly the first solution is correct.
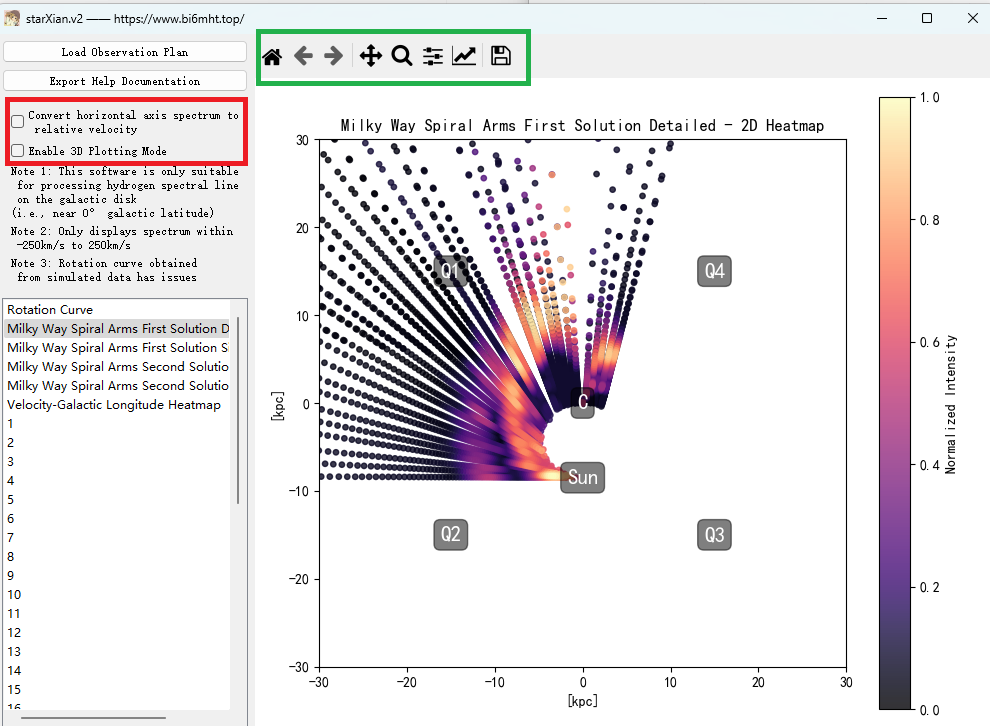
You can also try the content in the red box. Some image examples:
# Creating Data
# Create New Folder
Create a new folder with any name, such as "Newfile", as shown below:
# Copy Spectrum Files
First record the observation time (file creation or modification time) and the right ascension and declination pointed to for each spectrum file exported by IF Average.
Name the spectrum files sequentially according to observation time (or galactic longitude order) as 1.txt, 2.txt, 3.txt, 4.txt... (quite flexible, can also be named curve_1_freq.txt, curve_2_freq.txt, curve_3_freq.txt... etc.), then copy them to the Newfile folder.
When observing, to understand the pointing right ascension and declination, you can use a star chart, refer to: https://www.bi6mht.top/radioastronomy/software/ 星座盘 /
For concepts of right ascension and declination, see: https://www.bi6mht.top/radioastronomy/manual/ 定位射电源在天空中的位置(赤经和赤纬)/ You can search for videos on B 站 for more intuitive understanding.
Copy spectrum files to Newfile folder
# Create Observation Plan File
Create a txt text file in Newfile, can be named "set" or other names, as shown below. This is an observation plan file recording the observer's location and spectrum information.
# Add Observation Location
Lines starting with # will be ignored.
Add timezone information at the beginning of the observation plan file (red), for example, if observation time uses Beijing time (UTC+8), fill in 8 here; if observation uses UTC-5 timezone, fill in -5.
Add the observer's location on the second line of the observation plan file (green): longitude(°), latitude(°), altitude(m).
You can try querying the longitude and latitude of your observation city at: https://jingweidu.bmcx.com/. If altitude is unknown, you can arbitrarily set it to 50m.
# Add Spectrum Information
Now observe the information circled in the purple box.
The character '1' represents that this spectrum file is '1.txt'
'20211030154502' represents that spectrum '1' was observed at 2021-10-30 15:14:02 (since the first line was filled with 8, i.e., UTC+8, this is Beijing time).
'17h4m' is the pointing right ascension value, can also be equivalently written as '256', '256°00'00"', '256d'; '-41d' represents the pointing declination, can also be equivalently written as '-41', '-41d00m00s', '-41°00'00"', etc. It's recommended to directly read the right ascension and declination from the star chart and fill them in.
Pay attention to spaces when filling in.
Fill in subsequent lines in this format until all spectrum file information is completed.
Add spectrum information line by line
# Sponsorship
If interested, you can sponsor me the price of a cola by visiting my personal blog https://www.bi6mht.top and clicking Donate at the bottom of any article.